LinkedIn Engagement Rate 2026: Benchmarks, Views vs Impressions
What is a good LinkedIn engagement rate in 2026? Benchmarks by industry, audience size and format, the views-vs-impressions difference, and how to read each metric.
Table of Contents

Grow your LinkedIn/X
audience now
AI-powered content creation and scheduling for LinkedIn & X.
Try Propelr for Free
The short answer
A good LinkedIn engagement rate in 2026 is roughly 2–5% of impressions. Where you land inside that range depends mostly on how big your audience is:
- Under 5,000 followers: 4–8% is normal. Small audiences engage at high rates.
- 5,000–50,000 followers: 1–3%.
- Over 50,000 followers: 0.5–2%. You get far more impressions, but a smaller share of them convert.
Median organic engagement across large post samples sits near 1.5–2.1%, with 3–6% counted as above average and 6%+ as excellent. If you are below 1% at any audience size, the problem is usually format and hook, not frequency.
Everything below is where those numbers come from, how they break down by industry and post format, and what impressions and views actually measure.
What counts as engagement
Engagement is any action that signals interest in your content or profile:
- Likes — one click. Low effort, but still a signal.
- Comments — stronger. Someone stopped to write, and the algorithm treats comments as high-value.
- Shares and reposts — very strong. You are being spread to someone else's network.
- Saves — the post was worth returning to. Weighted heavily for long-term value.
- Profile visits and follows — the click that turns reach into an audience.
Engagement rate is normally (likes + comments + shares + other) ÷ impressions. Some tools divide by followers instead, which produces a very different number — always check which denominator a benchmark uses before comparing yourself to it.
If you just want your own number, our LinkedIn engagement rate calculator runs both formulas and rates the result against the benchmarks below.
Views vs impressions: the difference
These get used interchangeably and they should not be.
- Impressions count how many times your post was shown on screen — in the feed, in search, anywhere. One person scrolling past twice generates two impressions.
- Views usually describe deeper consumption: a video played, a document opened. For plain text posts the two collapse into roughly the same thing, and impressions is the metric analytics tools report.
Impressions are opportunities to be seen. Views are evidence someone actually stopped. The job is turning the first into the second, and the second into a comment or a share.
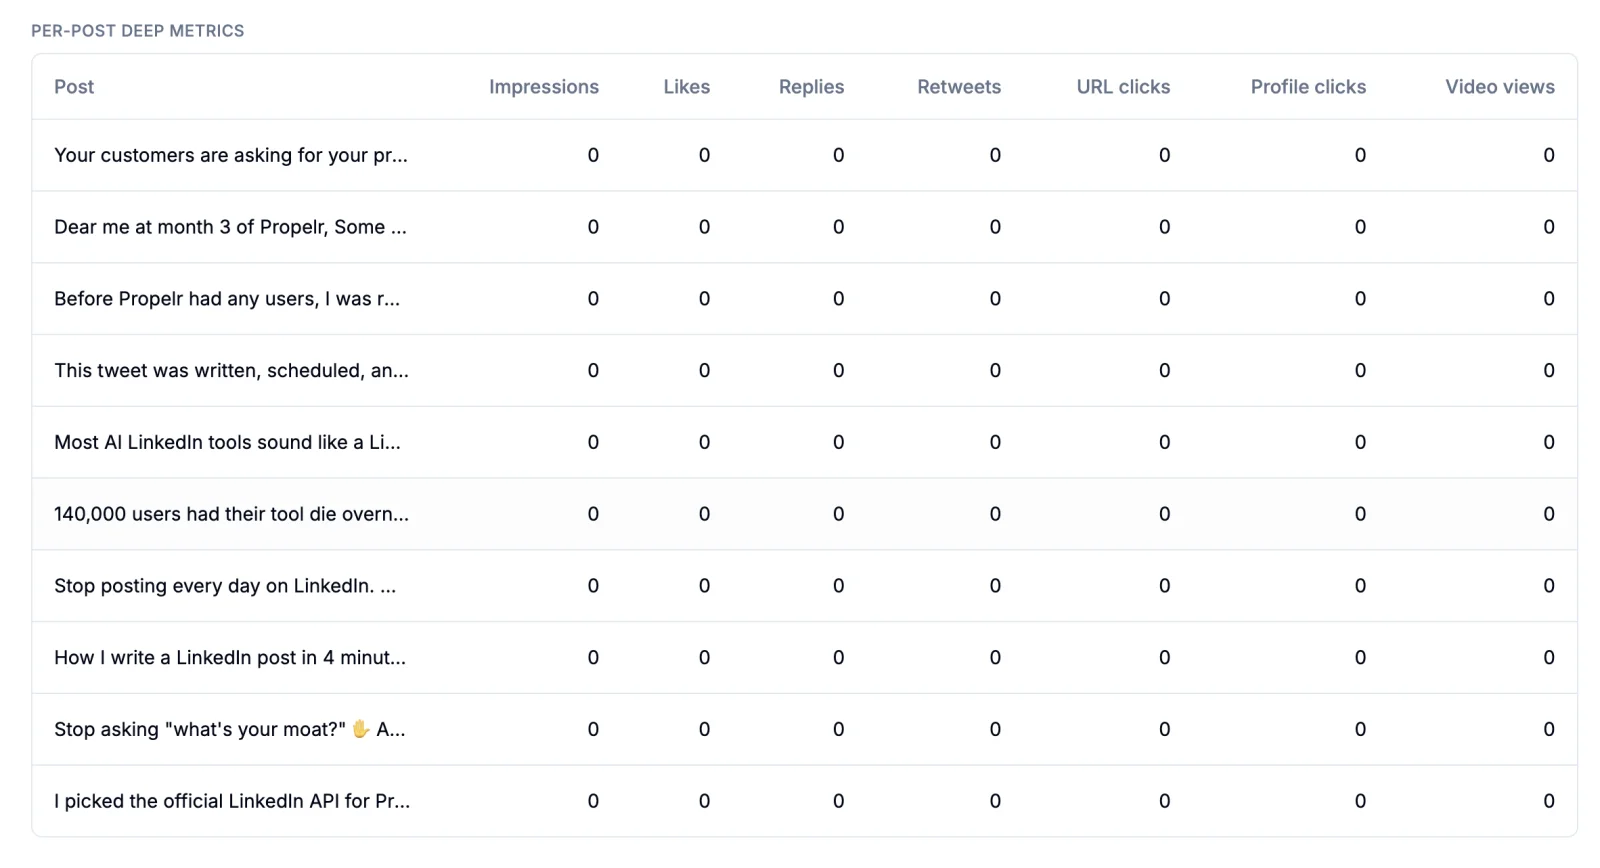
Per-post metrics in Propelr: each post broken down by impressions, likes, replies, reposts, URL clicks, profile clicks, and video views.
Benchmarks by audience size
Statista, working with Metricool, reports that the average LinkedIn post received 1.74 instances of engagement in 2025, up from 1.57 in 2024 — measured across 64,409 accounts and 771,413 posts. That is a useful floor for "how many reactions should one post get."
Reports that measure engagement as a rate against impressions — Closely and Social Insider among them — generally show:
| Audience size | Engagement rate (likes + comments + shares ÷ impressions) | Source |
|---|---|---|
| 1,000–5,000 followers | 4–8% | Closely, Contentin |
| 5,000–50,000 | 1–3% | Multiple benchmarks |
| 50,000+ | 0.5–2% | Closely, industry reports |
The pattern is consistent across every published dataset: smaller accounts post to people who actually know them, so a higher share of impressions converts. Growth trades rate for reach. A 0.8% rate on 50,000 followers is a healthier post than a 6% rate on 800.
Analyses of very large post sets — Postking's sample of 2.3M posts — put the median for organic content around 1.5–2.1%, with tiers at 3–6% for above average and 6%+ for excellent.
Benchmarks by industry
Industry figures come from analyses of thousands of business pages. Ranges from published reports:
| Industry | Engagement rate range | Source |
|---|---|---|
| Retail / consumer goods | 3.9–4.0% | Closely, industry benchmarks |
| B2B tech / SaaS | 3.2–3.6% | Closely, Social Insider |
| Healthcare | 3.3% | Closely |
| Education | 2.8–4.0% | Multiple |
| Professional services | 2.8–3.2% | Closely |
| Financial services | 2.6–3.2% | Multiple |
Two caveats worth more than the table itself. These are company page benchmarks, and personal profiles reliably outperform pages — if you post as yourself, treat these as a floor. And the spread within any industry dwarfs the spread between them, so a 3.2% industry average tells you far less than your own last twenty posts do.
Benchmarks by content format
This is the breakdown that actually changes what you do on Monday. Social Insider and Closely report engagement by post format:
| Format | Engagement rate (by impressions) | Source |
|---|---|---|
| Multi-image posts | 6.60% | Social Insider |
| Native document (carousel PDF) | 6.10% | Social Insider |
| Video | 5.60% | Social Insider |
| Standard image | ~4.85% | Social Insider |
| Text-only | ~4.00% | Social Insider |
The gap between a multi-image post and a text-only post is roughly 65% — larger than the gap between the best and worst industries. Format is the highest-leverage variable you control, and it is the one most people never change.
One more shift worth internalising: saves and reposts now carry as much weight as likes. A post with modest likes but heavy saves and shares will out-travel a like-heavy post, because the algorithm reads saves as durable value rather than a reflex tap.
Why the algorithm rewards engagement, not impressions
LinkedIn does not simply count how many times a post was shown. It weighs who engaged and how:
- Early engagement. Comments and likes in the first 45–60 minutes usually decide whether a post gets a second distribution push.
- Meaningful engagement. A thoughtful comment beats a passive like by a wide margin. A share beats both.
- Dwell time. For carousels and video, how long people stay on the content feeds back into reach.
A strategy that chases impressions without a plan for what happens after the impression will plateau. Reach is downstream of engagement, not the other way round.
How to get more engagement
Optimise for the first hour. Post when your audience is actually online and reply to every comment in the first 45–60 minutes. Early signals decide the second push. Asking a few peers for a genuine take — not a "great post!" — works; asking for empty engagement does not.
Write posts that invite a reply. End with a real question: one recommendation, one mistake, one number. Take a position people can disagree with. Posts that earn comments earn secondary reach.
Make things worth passing on. Frameworks, step-by-step playbooks, "mistakes I made" lists, and data-led insights get shared because they are useful to someone else. Vague thought leadership does not.
Fix the profile the clicks land on. When someone clicks your name, the headline, About section, and banner decide whether they follow. Posts drive profile visits; the profile converts them. That flywheel — better profile, more follows from each post, larger audience for the next — compounds faster than posting frequency does.
Be in the network, not just on it. Comment on other people's posts before you publish so your name is already in front of them. Build a small circle of peers who genuinely engage with each other. Use DMs to deepen relationships. Not algorithm gaming — just being a participant rather than a broadcaster.
Engagement, followers, leads
Engagement is not a vanity metric. Likes, comments, and shares tell the algorithm to widen distribution, which raises impressions, which grows followers, which gives the next post a larger starting audience. Leads come out the far end of that chain when your content and profile point at the same offer.
So: track your rate against impressions, aim for comments and shares rather than likes alone, and change format before you change frequency.
Keep reading
- How often to post on LinkedIn — frequency is the variable people change first and should change last.
- The best time to post on LinkedIn — timing feeds the first-hour engagement window above.
- How to write a LinkedIn hook — the lever that moves engagement rate most.
- Why LinkedIn carousels work — the native-document format at 6.10% in the table above.
If you want to keep that consistent without spending hours on it, Propelr drafts posts in your own voice, builds native carousels, and schedules them.
→ Try Propelr for your LinkedIn content — free credits on signup.
Sources
Every benchmark above comes from a published report. Methodology and sample sizes differ between them, so the ranges are wider than any single study would suggest — that is deliberate.
| What it covers | Source |
|---|---|
| Average engagement per post, 2024–2025 (64,409 accounts, 771,413 posts) | Statista / Metricool |
| Engagement rate by industry, format, and page size | Closely |
| LinkedIn benchmarks (1M+ posts, 9k pages) | Social Insider |
| Engagement rate tiers and industry breakdown (2.3M posts) | Postking |
| Engagement by follower count | GrowWithGhost |
| Engagement rate formula and median rates | Rival IQ |
Content and growth research team at Propelr
The Propelr team publishes playbooks from inside a content platform used to create, schedule, and analyze thousands of LinkedIn and X posts. Articles are grounded in real usage data and current platform behavior, not recycled advice.
Keep reading
All posts
How Often to Post on LinkedIn in 2026 (Real Data)
Buffer's 2M-post study says post more. Everyone else says 2-5x a week. Here's why both are right, and how to find your own ceiling.
Best Time to Post on LinkedIn in 2026 (Data-Backed)
The best time to post on LinkedIn in 2026, backed by data from millions of posts. Day-by-day windows and how to find your own peak hours.
How to Write a LinkedIn Hook: 12 Formulas + Examples
How to write a LinkedIn hook that earns the 'see more' click: the 210-character rule, 12 proven hook formulas with examples, and the mistakes that kill reach.