LinkedIn + X engagement, in one view
LinkedIn's analytics is shallow, X analytics is paywalled, switching tools to track your numbers takes minutes you don't have. Propelr pulls both into one dashboard with 2026 benchmarks.
Try analytics free →No credit card required
You can't improve what you can't see
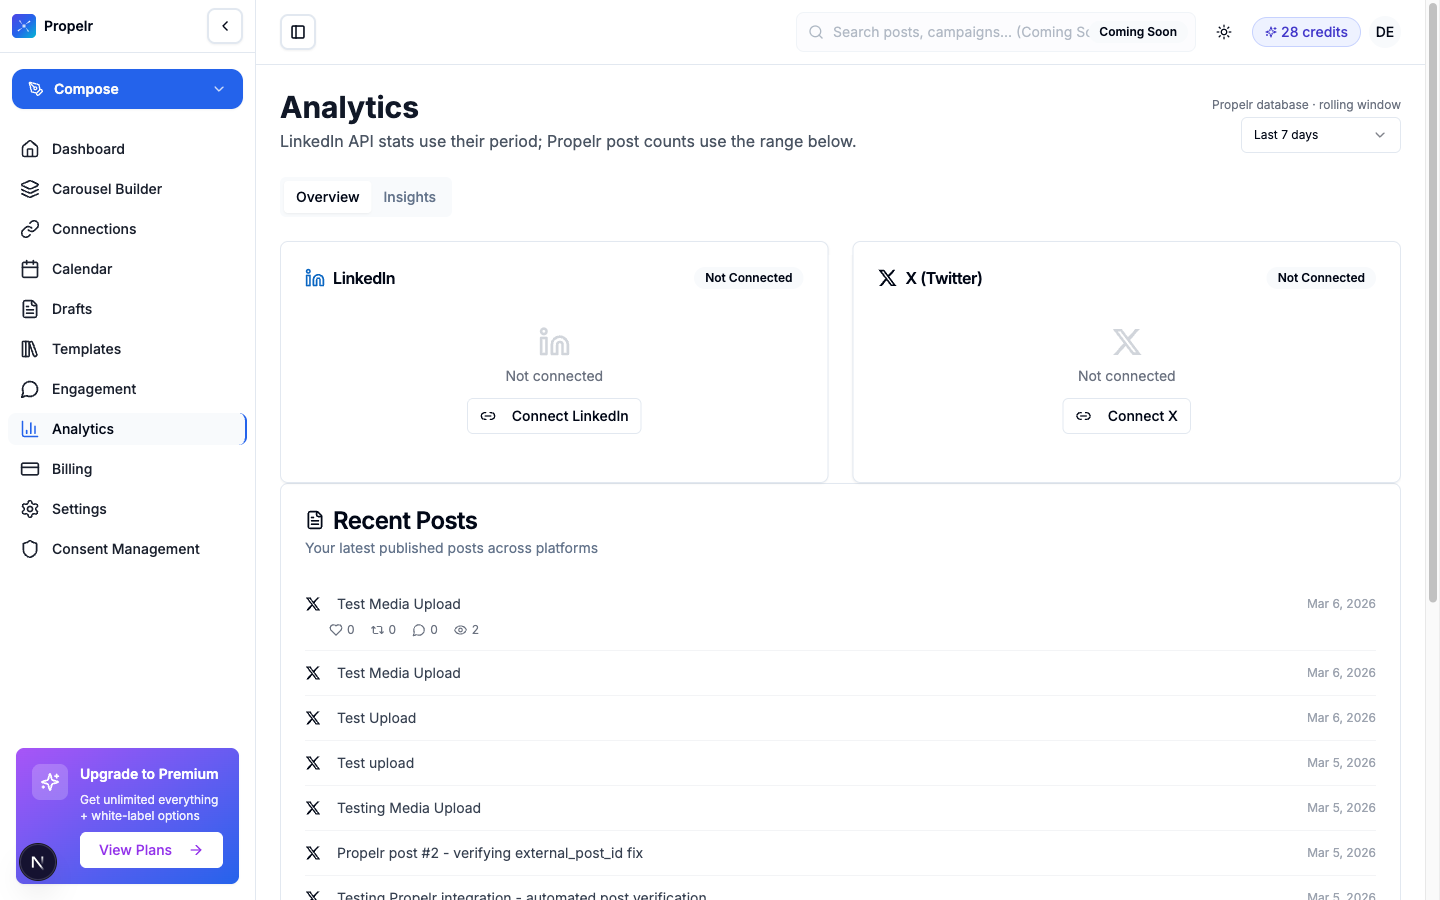
LinkedIn's native analytics shows you raw numbers without context. X's analytics hides depth behind a Premium paywall. Most creators look at "did this post do well?" once a week, can't spot patterns, and stop measuring. Without data, you can't double down on what works.
- LinkedIn native analytics: shallow, no per-post deep metrics on free tier
- X analytics: deeper data behind Premium paywall
- Cross-platform comparison: impossible without spreadsheet work
- Without benchmarks (what's "good?") raw numbers are meaningless
How it works
- 1
Connect your accounts
LinkedIn + X via official OAuth. Propelr starts syncing your post-level metrics from the moment you connect.
- 2
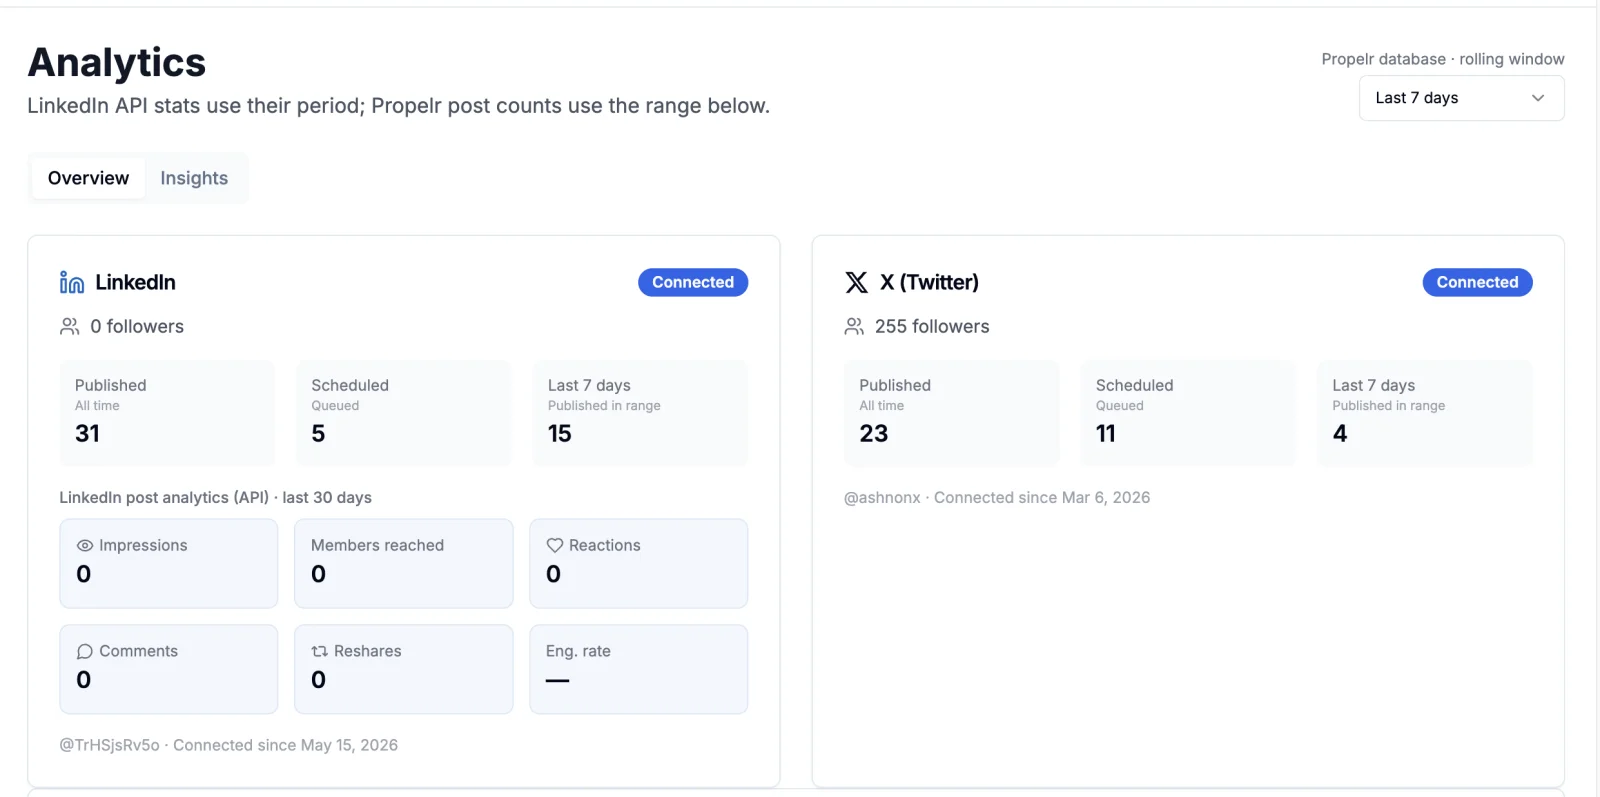
See unified metrics
Single dashboard with both platforms. Published count, scheduled queue, impressions, reactions, comments, reshares, engagement rate.
- 3
Drill into per-post metrics
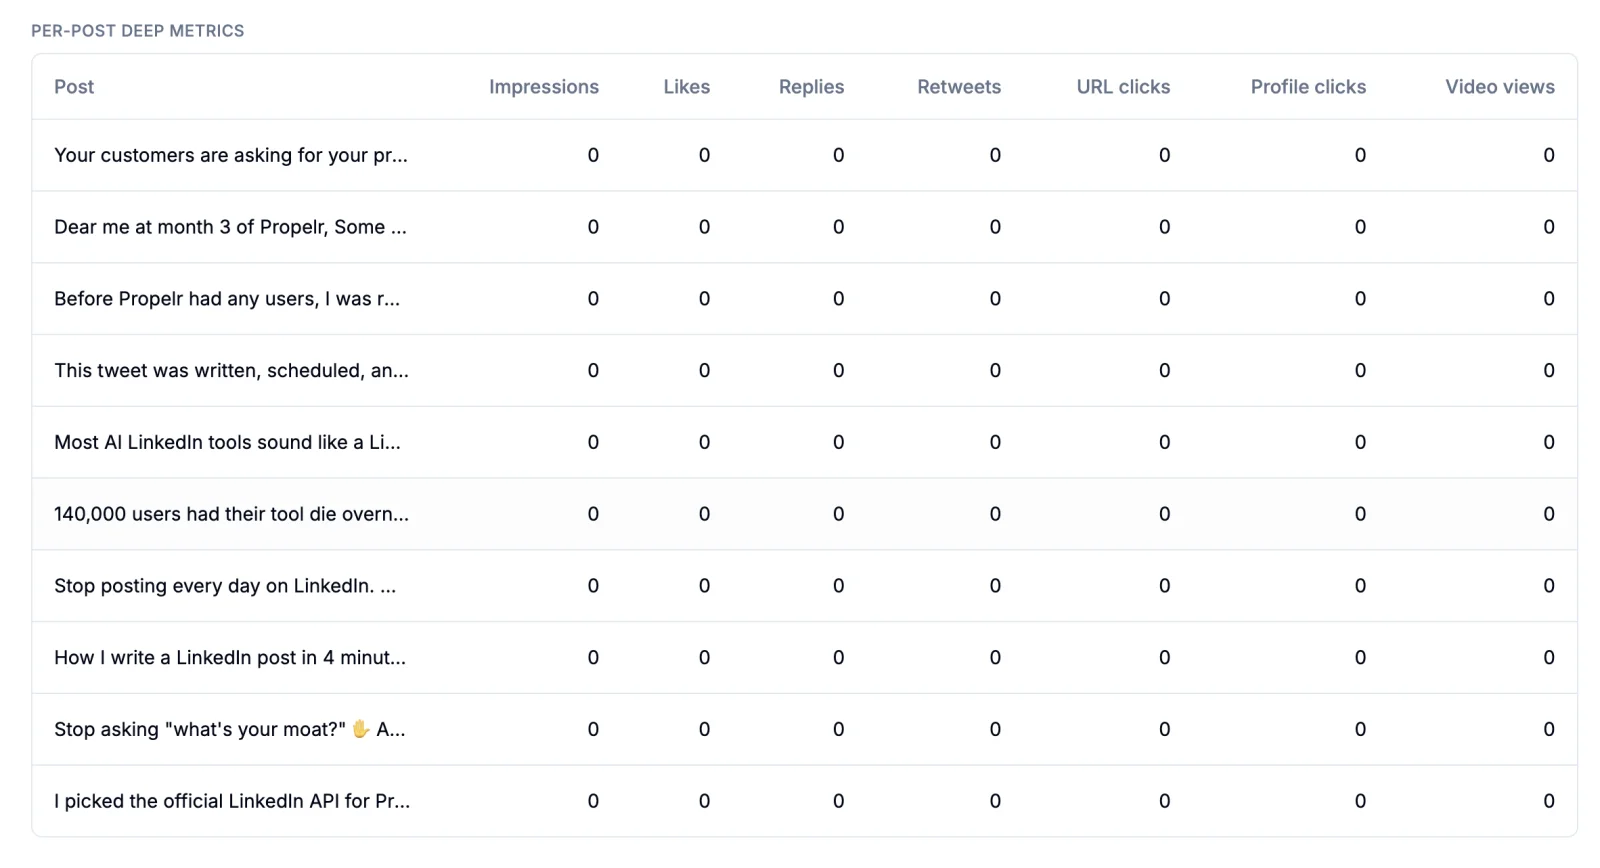
Click any post to see impressions, likes, replies, retweets, URL clicks, profile clicks, video views. Compare across posts to spot patterns.
Capabilities
Both platforms in one view
No tab-switching between LinkedIn analytics and X Premium. Both feed into a single dashboard.
Per-post deep metrics
Impressions, likes, replies/comments, retweets/reshares, URL clicks, profile clicks, video views — per post.
Engagement rate calculation
Calculated both ways — impressions-based and follower-based — with 2026 benchmarks for personal profiles.
Top-performer surfacing
Sort posts by engagement rate or absolute engagement to identify what to repeat.
Refresh on demand
Pull latest data manually or via background sync every 12 hours.
Benchmark context
Every metric is shown against the 2026 personal-profile benchmark so "is this good?" has an answer.
Who it's for
Data-driven creators
If you want to know which hook formats, post lengths, or topics work for your audience, you need per-post metrics.
Founders measuring content ROI
Content effort is invisible without data. Analytics turns "I post a lot" into "this kind of post drives X% lift in profile visits."
Anyone past the "just post" stage
After 3 months of consistent posting, the question shifts from "am I posting enough?" to "what's working?" Analytics answers it.
Frequently asked questions
How often does it sync?
Background sync every 12 hours. Manual refresh button on the dashboard pulls fresh data on demand.
Do you have historical data?
From the moment you connect your accounts. LinkedIn and X don't make pre-connection historical data fully available via API, so analytics starts the day you connect — much like Buffer or Taplio.
Can I export?
CSV export is on the roadmap. For now, the in-app dashboard is the analytics surface.
Are the benchmarks accurate?
Benchmarks reflect commonly cited 2026 personal-profile engagement rates from public sources. They're directional, not precise — useful for "is this good?" framing, not for fund-of-record reporting.
Try Analytics free
LinkedIn + X engagement metrics in one view with 2026 benchmarks. See which posts work and why — without switching between LinkedIn analytics, X analytics, and a spreadsheet.
Try analytics free →